(Please note this post was published last 12th sept. 2012 in the Spanish version of this blog)
Recently we used a very interesting tool to analyze Java applets: JavaSnoop, developed for BlackHat USA 2010 by Arshan Dabirsiaghi. Broadly speaking, the tool allows us to adhere (attach) to a Java process or start it and intercept the calls made. In addition to intercept these calls and view its contents, we can change the arguments of the methods we are intercepting and modify the return value of the function.
Let’s see how to intercept a Java applet method:
1. Download the latest version of the application: http://code.google.com/p/javasnoop/downloads/list
Note: It is recommended to install the application in a directory that does not contain spaces on Windows (eg C:\JavaSnoop).
2. Download the latest version of Java SDK (requires restart after installation).
3. Set the location of the JAD binary in ““Settings > Manage JAD > Set jad path””. Download from the author website. This will allow us to decompile the classes.
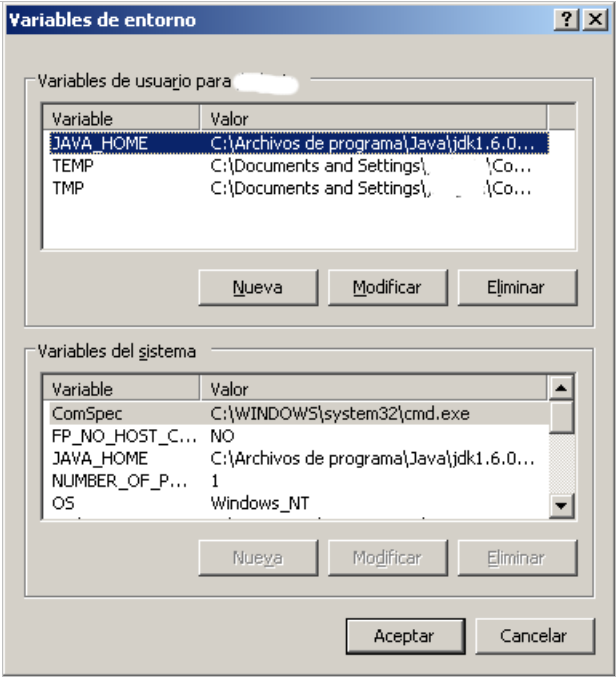
4. We make sure that the JAVA_HOME environment variable for our user is set.
5. To avoid problems with permissions when injecting, JavaSnoop contains in the Resources folder the file unsafe.policy. We copy this file to %USERPROFILE%\.java.policy. This directory should contain a file .java.policy. After our analysis is recommended to restore the initial configuration.
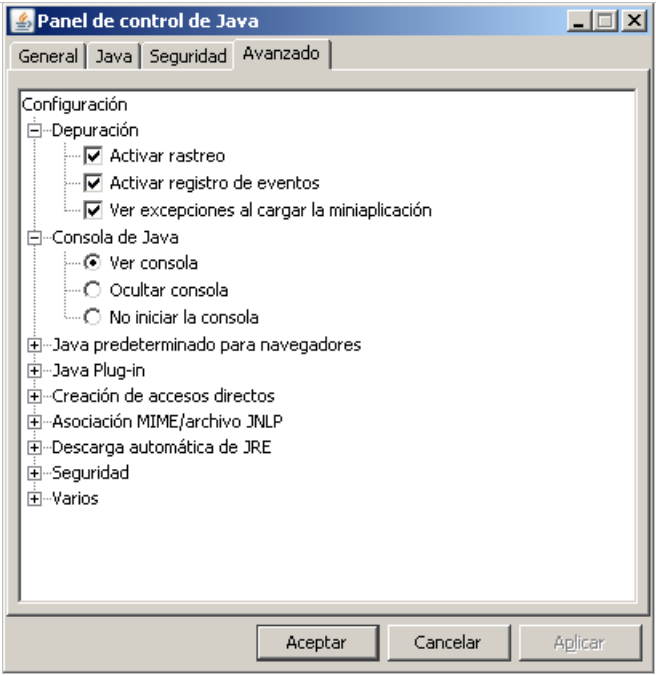
6. It is advisable to activate the Debug Console in Java and keep it active for messages.
7. It is very important the order in which JavaSnoop and the java application are started. With some applets is strictly necessary that JavaSnoop is running before launching the browser.
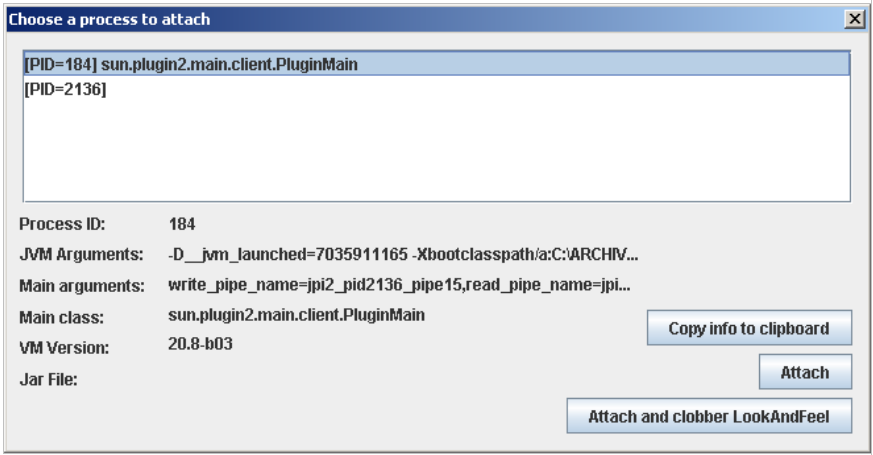
8. Once started JavaSnoop we use the feature “An existing process“. In this case we see the PID 184 which is an applet that we started in Internet Explorer. Then hit the Attach button to adhere to process 184:
9. Once we have adhered to the process, we will set a “New hook“. To do so, click on the “Add new hook“. If you still do not know what class and method you want to hook, go to Browse, what will open a new window where you can select the class you want.
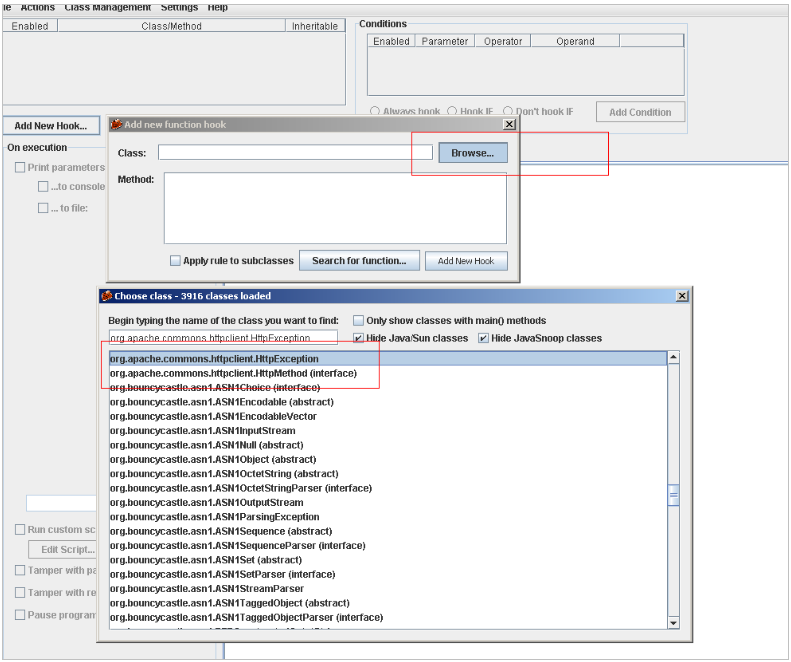
Now we select the method we are interested in:

Once selected the class and the method, we go back to the main window:
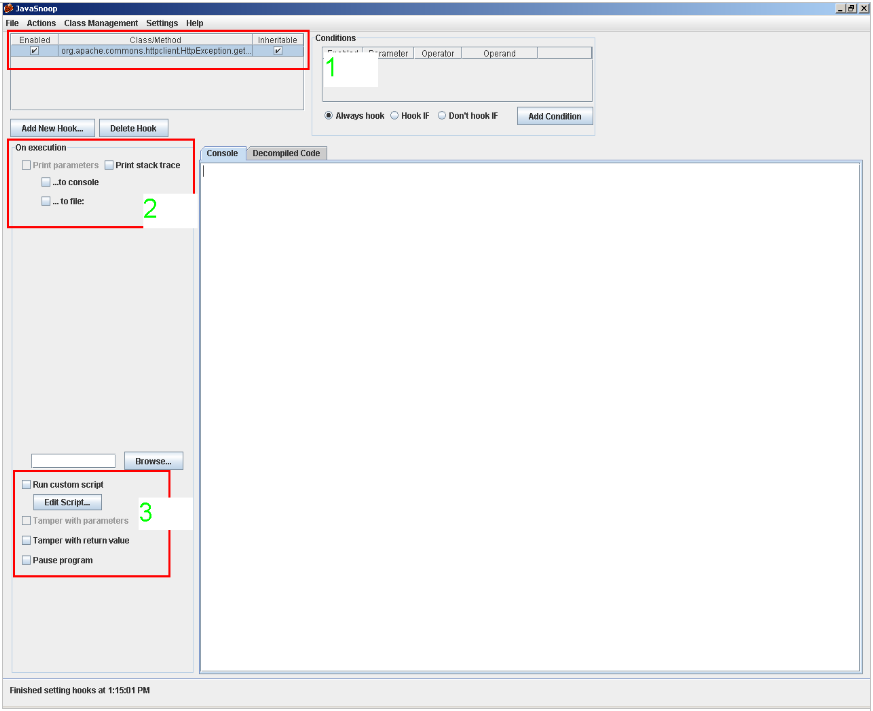
In this window, if we have selected the method (point 1) we will be able to set the actions to be undertaken by JavaSnoop: print the parameters when the method is invoked, print the contents of the stack, modify the parameters that are passed to the function and the return values. (points 2 and 3).
10. We can also see features of the process that we have attached to in the Actions menu.
With these steps, you are ready to intercept any Java application in a simple and fast way.
